artwork by DALLE-3
Seeing Logic - The Power of Existential Graphs and Visual Thinking
Logic Puzzles
Part 3 of 3Logic is inherently challenging—not only difficult to get right, but often tough to even grasp. Abstract concepts do not come naturally to most people, which is why visual logic can be transformative. Visual logic makes logic visible, bridging the gap between abstract reasoning and intuitive understanding. When logic is represented visually, we begin to comprehend it in a more intuitive way, similar to how we understand physical objects like chairs or doors. This matters because understanding logic is not just a niche skill for mathematicians or computer scientists; it is fundamental to how we perceive and interact with the world.
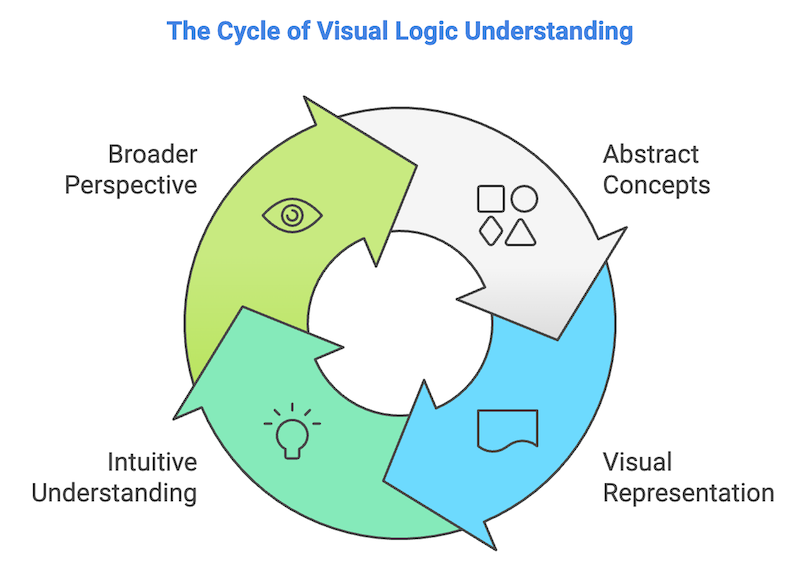
Figure. This cycle emphasizes the power of visual logic in making abstract ideas more accessible and intuitive.
We can listen to this article as a Podcast Discussion, which is generated by Google’s Experimental NotebookLM. The AI hosts are both funny and insightful.
images/seeing-logic-with-existential-graphs/Podcast_Seeing_Logic.mp3
Charles Sanders Peirce and Existential Graphs
The idea of visualizing logic is not new. In the 19th century, Charles Sanders Peirce, a philosopher and logician, sought to make abstract ideas concrete. He developed a system called existential graphs, which were diagrams that depicted logical relationships in a visual format. By drawing logic on a blank piece of paper, Peirce aimed to transform logic into something visible, making abstract relationships tangible and accessible. For example, drawing a circle around a statement indicated its negation—”not that.” This simple visual representation allowed individuals to see logical operations rather than solely interpret symbols mentally.
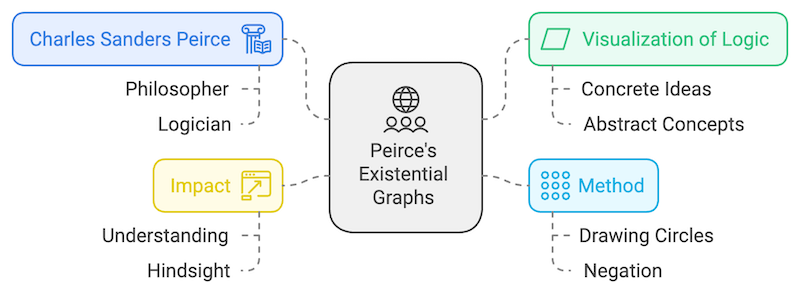
Figure. Developed by Peirce, existential graphs allow abstract concepts to be represented concretely through visualization of logic.
Peirce’s existential graphs provided a way to represent logical statements visually. For instance, to express “the sky is not blue,” one would write “the sky is blue” inside a circle, with the circle representing negation. This visual approach made abstract logic concrete, allowing individuals to see logical operations rather than interpret abstract symbols mentally.
Although it may seem obvious in retrospect, Peirce’s approach was innovative for his time. By representing logic visually, he demonstrated that abstract concepts could become more intuitive when made visible. His existential graphs transformed the invisible workings of logic into tangible diagrams that the brain could readily comprehend.
Peirce emphasized the power of iconic representations, where the structure of a symbol resembles the concept it represents, making it intuitively easier to understand. Existential graphs embody this principle by structuring logical statements in a visual format, using different types of graphs to represent various levels of logic, namely Alpha Graphs and Beta Graphs.
Alpha Graphs: Visualizing Propositional Logic
Alpha graphs are the simplest form within Peirce’s existential graph system, corresponding to propositional logic. In propositional logic, statements are treated as simple units (propositions) that can be combined using logical operations like “and,” “or,” and “not,” without reference to specific entities or variables. Alpha graphs visually represent these statements and their combinations using straightforward conventions:
- Letters or symbols represent individual propositions.
- Enclosures called “cuts” are used to represent negation. Placing a proposition within a cut negates that proposition, analogous to a “not” in traditional symbolic logic.
For example, consider the statement “It is not raining.” In an Alpha graph, the proposition “It is raining” would be written, and a cut (a closed curve) would be drawn around it to indicate negation.
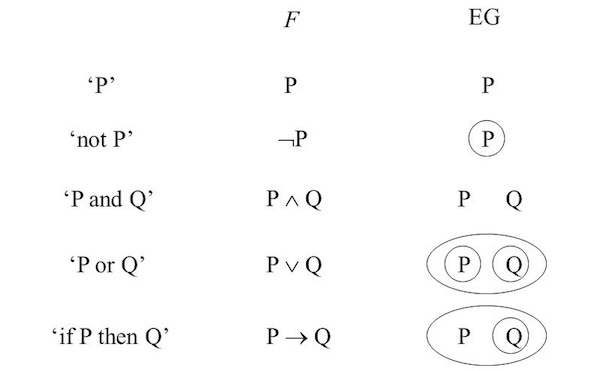
Figure. This diagram illustrates Peirce’s Alpha Graph notation, which represents propositional logic in a graphical format. The left column shows common logical statements in English, the middle column (F) displays their representation in traditional symbolic logic, and the right column (EG) demonstrates how each statement is expressed in Alpha Graphs.
By using Alpha graphs, Peirce provided a way to visualize basic logical operations without the need for textual or symbolic manipulation, allowing users to “see” the relationships between propositions. This makes Alpha graphs an iconic and intuitive way to represent propositional logic.
Beta Graphs: Extending to Predicate Logic
Building upon Alpha graphs, Beta graphs incorporate predicate logic (also known as first-order logic), which introduces variables and relationships between objects. Predicate logic allows for more complex statements involving individual entities and their properties or relationships, such as “All humans are mortal” or “Socrates is a human.” In Beta graphs, Peirce introduced additional features:
- Lines of identity represent specific individuals or objects, connecting parts of the graph to indicate that two propositions refer to the same entity.
- Predicates and quantifiers allow expressions like “some” or “all” to be represented graphically, enabling the graphs to capture relationships between different variables or individuals.
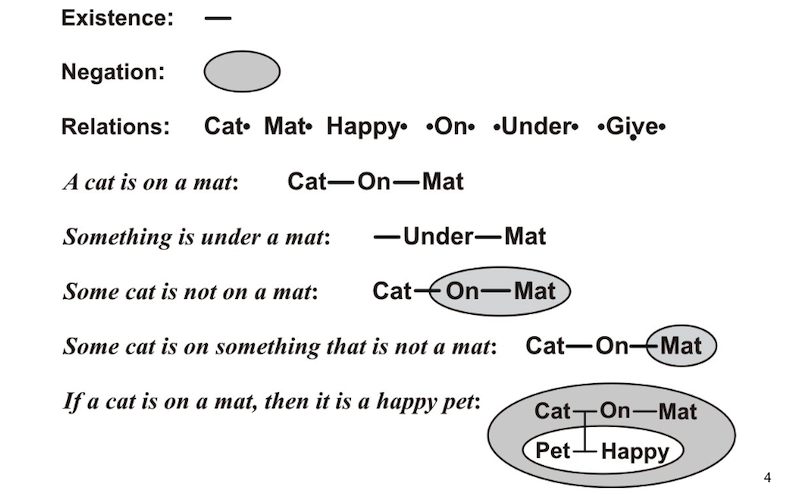
Figure. source: John F. Sowa, Existential Graphs - The simplest notation for logic ever invented, 10 Jan 2020.
Here are some examples:
- Basic Existence and Relationships:
- Statement: “A cat is on a mat.”
- Representation: The words “Cat,” “On,” and “Mat” are connected by lines, forming a simple diagram where “Cat” is linked to “Mat” through the relation “On.”
- Explanation: This visually represents the existence of a cat and its relation to the mat.
- Existential Statement:
- Statement: “Something is under a mat.”
- Representation: A line connects “Under” to “Mat,” without specifying what is under the mat.
- Explanation: This denotes that there exists something under the mat, aligning with the existential quantifier in predicate logic.
- Negation:
- Statement: “Some cat is not on a mat.”
- Representation: The relation “Cat On Mat” is enclosed within a cut to signify negation.
- Explanation: This indicates that there exists a cat that is not on a mat.
- Conditional Statements:
- Statement: “If a cat is on a mat, then it is a happy pet.”
- Representation: The antecedent “Cat On Mat” is enclosed within a cut, leading to the consequent “Pet Happy.”
- Explanation: The enclosing cut signifies that if the condition is met (a cat is on a mat), then the result or consequence (the cat is a happy pet) follows.
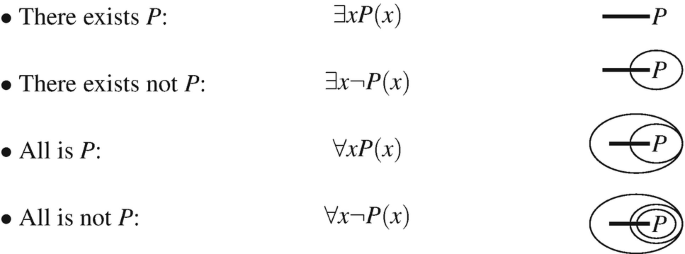
Figure. This diagram shows how existential and universal quantifiers are represented in Peirce’s Beta Graphs, a part of his Existential Graph system for predicate logic.
By using these visual conventions, Beta graphs enable the representation of complex logical structures, including negations, existential quantifiers, and conditionals, in a graphical format. This system allows users to visualize logical relationships without relying solely on symbolic notation, making logical inference and relationships more intuitive.
Connecting Existential Graphs to Modern Knowledge Graphs
Peirce’s emphasis on interconnectedness in his graphs suggests that propositions are inherently relational and form a network of meanings. This approach mirrors the structure of modern knowledge graphs, where meaning is derived from the web of relationships between entities. Knowledge graphs, such as those used in search engines or AI applications, represent information through nodes and edges, much like Peirce’s existential graphs.
His influence reaches into fields like AI and cognitive psychology, inspiring early semantic networks and researchers such as John F. Sowa. Sowa’s conceptual graphs, a precursor to semantic networks, reflect Peirce’s visual logic. These early networks paved the way for today’s knowledge graphs, illustrating how Peirce’s ideas have influenced modern knowledge representation.
Moreover, Peirce designed existential graphs to support logical inference visually. This idea is echoed in the reasoning capabilities of modern knowledge graphs, which use computational mechanisms to facilitate inference and deduction, rooted in Peirce’s vision. Peirce’s work, merging philosophy, logic, and semiotics, anticipated the interdisciplinary nature of modern knowledge graphs, which draw from linguistics, data science, and computer science to represent knowledge across various fields.
The Human Brain: Wired for Visual Understanding
Evolutionary Roots of Visual Thinking
Our capacity for visual thinking is deeply rooted in our evolutionary history, giving us an innate advantage in processing visual information. Humans evolved to understand the world visually; we did not evolve to read strings of symbols or lines of text. The human visual cortex is significantly larger compared to that of other primates, indicating an enhanced capacity for processing complex visual information. This expansion has contributed to advanced cognitive functions, including language and abstract thinking.
For example, when walking through a forest and seeing a stick that resembles a snake, the brain quickly interprets the visual pattern, prompting an immediate response. This rapid visual processing underscores how our brains are wired to detect patterns, understand shapes, and perceive relationships between objects.
Applications of Visual Understanding
Visual representations are effective tools for learning and comprehension across various domains. For instance, when learning about how electricity flows in a circuit, a diagram with a battery, wires, and a light bulb allows individuals to visualize how current flows and how components connect, making the concept more graspable than abstract equations alone.
Similarly, explaining a family tree through a diagram enables immediate understanding of relationships that would be cumbersome to convey through text alone. Visual logic leverages this natural aptitude for visual processing, making abstract reasoning more concrete.
The Picture Superiority Effect is a well-documented phenomenon in cognitive psychology, indicating that individuals remember images more effectively than words. Studies have shown that people can recall images with high accuracy even after brief exposure, highlighting the power of visual memory. In educational settings, visual aids such as diagrams and charts enhance learning by making complex information more accessible and engaging.
Embracing the Complexity: The Messiness of Visual Logic
While Peirce’s work on existential graphs was innovative, it did not gain immediate widespread adoption, partly because visual logic can appear messy and complex. Traditional symbolic logic presents formulas that stay neatly in place, whereas visual logic involves drawing and connecting elements, which can resemble intricate webs.
However, this complexity can be a feature rather than a drawback. The “messiness” of visual logic reflects the true nature of real-world problems, which are often complex and interconnected. Being able to see the full picture, with all its nuances and relationships, can lead to deeper understanding and new insights.
For example, mind maps are a form of visual logic that embrace complexity. When brainstorming ideas or planning projects, individuals often create mind maps that branch out in multiple directions. Although these diagrams can look chaotic, they allow for the exploration of connections between concepts that might not be apparent in a linear format. This visual exploration can lead to breakthroughs and innovative solutions that linear thinking might overlook.
By embracing the inherent complexity in visual logic, we can better navigate complex systems and appreciate the interconnectedness of ideas, ultimately enhancing problem-solving and creative thinking.
Visual Logic in Education
The potential benefits of visual logic are substantial, especially in education. Abstract concepts can be challenging for students to grasp when presented solely through text or symbolic notation. By making logic concrete and visual, we can enhance comprehension and engagement.
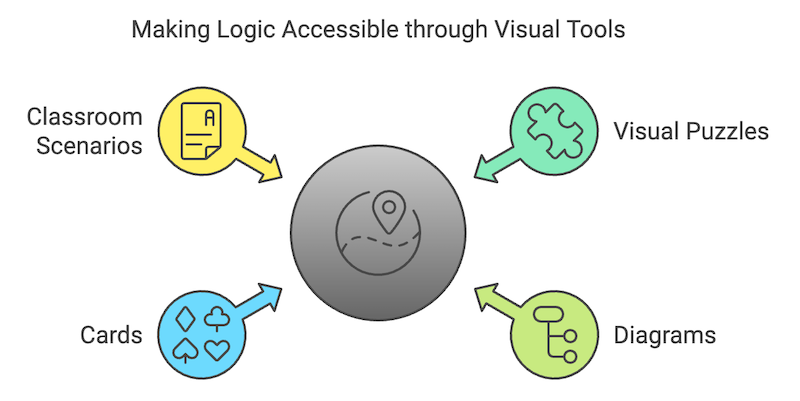
Figure. Different visual tools that make logic more accessible and engaging, including classroom scenarios, visual puzzles, cards, and diagrams.
Imagine a classroom where students solve logical puzzles represented visually, using cards and diagrams instead of symbols on a chalkboard. Teachers could present scenarios visually, such as showing the flow of electricity in a circuit or mapping out the relationships in a story. By manipulating visual elements, students can intuitively understand logical operations like negation or conjunction.
For example, in computer science education, visual logic diagrams can help students understand how algorithms work. Flowcharts visually represent the steps in an algorithm, making it easier to follow the logic and identify potential issues.
Similarly, when troubleshooting a computer network, visualizing the network’s layout can help identify where connections are failing. Network diagrams display routers, switches, and connections, allowing technicians to see the relationships between components and isolate problems more efficiently.
Standardizing Visual Language
One of the challenges of visual logic is establishing a common visual language. If individuals draw their existential graphs differently, the communication becomes less effective. However, this issue is solvable through standardization, allowing for shared understanding while preserving the benefits of visual thinking.
Throughout history, various visual languages have been developed to represent logic, mathematical relationships, or complex systems. Here are some prominent examples (see Historical References for more information):
| Visual Language | Developer(s) | Purpose | Common Usage |
|---|---|---|---|
| Venn Diagrams | John Venn (1880) | Represent set theory and logical relationships | Widely used in set theory, probability, and logic visualization |
| Flowcharts and Block Diagrams | Engineers, programmers (1940s-50s) | Represent processes, workflows, or algorithms | Modeling business processes, programming, engineering workflows |
| Conceptual Graphs | John F. Sowa (1970s) | Represent complex relationships in knowledge representation | Used in AI and knowledge representation |
| Unified Modeling Language (UML) | Grady Booch, Ivar Jacobson, James Rumbaugh (1990s) | Model object-oriented software | Software engineering to model system architecture and interactions |
| Petri Nets | Carl Adam Petri (1962) | Model distributed systems and parallel processes | Analyzing concurrent events in systems and computer science |
| Semantic Networks | Various, psychology and computer science (1960s-70s) | Represent knowledge networks | Foundational in AI, linguistics, and knowledge representation |
| Truth Tables and Karnaugh Maps | Various | Display and simplify Boolean logic outcomes and expressions | Digital logic design, circuit minimization, and logic demonstration |
| Mind Maps and Concept Maps | Joseph D. Novak (1970s) | Organize associative and hierarchical ideas | Education, brainstorming, knowledge organization |
These visual languages illustrate humanity’s ongoing effort to make complex systems understandable, each contributing to a richer landscape of visual representation. They are widely adopted across scientific, educational, and business contexts, demonstrating the effectiveness of visual tools in simplifying complexity and enhancing comprehension.
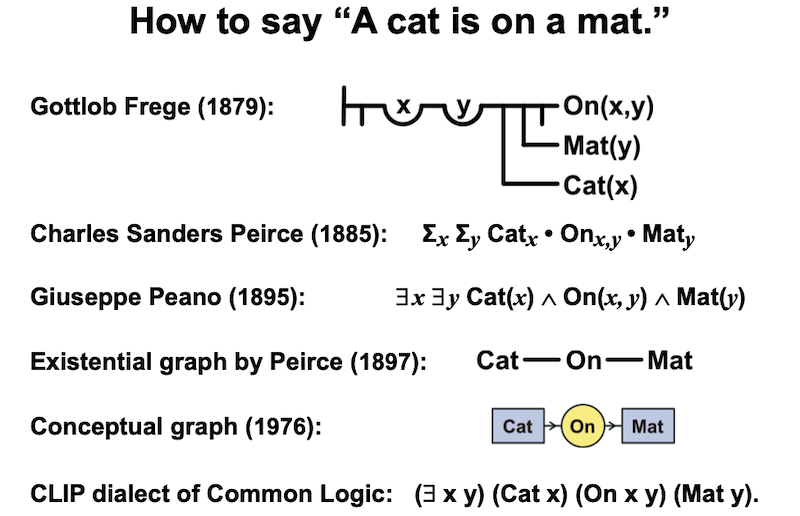
Figure. Various methods developed over time to express the simple statement, “A cat is on a mat,” in formal logicjjkk. This shows representations from Gottlob Frege (1879), Charles Sanders Peirce (1885), Giuseppe Peano (1895), Peirce’s Existential Graph (1897), Conceptual Graphs (1976), and the CLIP dialect of Common Logic.
The Role of AI in Advancing Visual Logic
Artificial intelligence (AI), with its proficiency in pattern recognition and system translation, has the potential to revolutionize visual logic, making abstract concepts more accessible than ever. AI can assist in generating visual representations of logical statements, translating traditional symbolic logic into visual formats that are easier to comprehend.
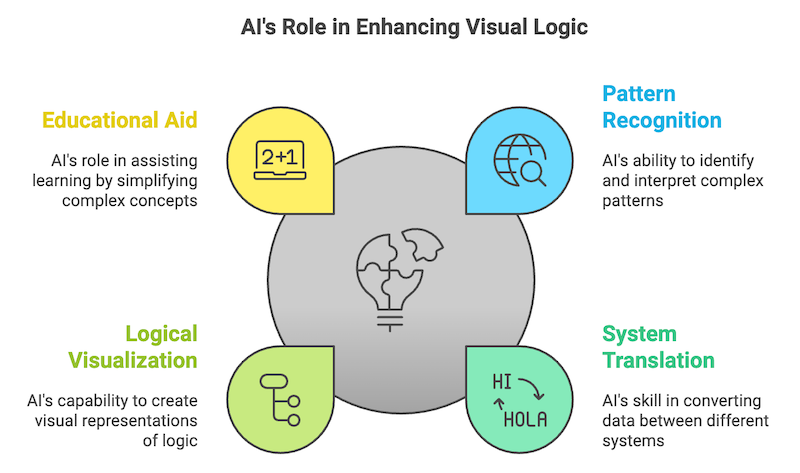
Figure. Summarizes AI’s role in enhancing visual logic by supporting various aspects of learning and representation.
Think of a student trying to understand the relationship between different biological processes. An AI could generate a visual diagram showing how photosynthesis relates to respiration, highlighting dependencies and interactions. AI can take these complex relationships and make them visible, helping students understand what’s going on without getting lost in the terminology. That’s where visual logic could become really powerful—not just as a tool for understanding existing knowledge, but as a way to explore new ideas.
But the thing about AI is that it’s only as useful as the people using it. AI could help make visual logic more accessible, but only if we teach people how to think visually. This starts in schools, where logic is usually taught in the most abstract way possible.
What if, instead, we taught kids logic the same way we teach them to draw? Start simple, with basic shapes and connections, and build from there. Make it part of how they learn to think about the world. Imagine a classroom where kids are using colorful diagrams to map out logical arguments, almost like piecing together a story. This way, logic becomes as natural as building with blocks or playing with Legos. And not just kids—adults too. The more people can think visually, the more clearly they’ll be able to see what’s really happening.
Visual Logic Beyond Education
There’s a lot of potential for visual logic beyond just education. It could change how we communicate in general. Most arguments are hard to follow because they’re hard to see. If we could see the logic behind different arguments, we might have better conversations—less talking past each other, more understanding what the other person is actually saying.
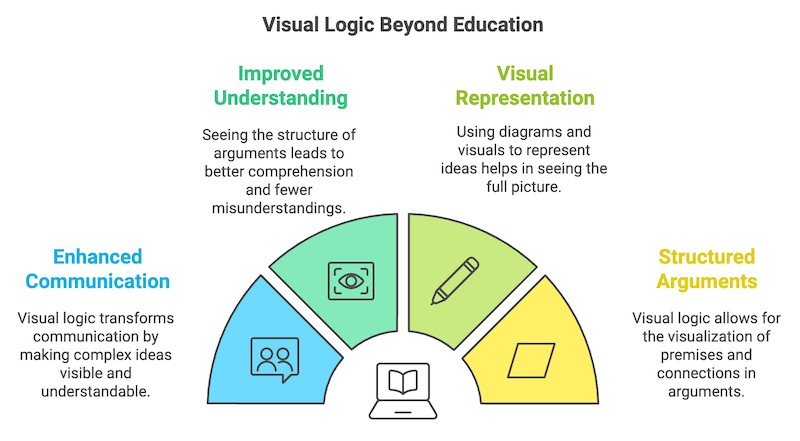
Figure. Explores how visual logic can extend beyond educational contexts to enhance various aspects of understanding and communication.
Visual logic can extend into our daily life. Improved Understanding allows individuals to see the structure of arguments, leading to better comprehension and reducing misunderstandings. Visual Representation uses diagrams and visuals to convey complex ideas, providing a holistic view. Enhanced Communication transforms the way complex information is shared, making it more accessible and clear. Structured Arguments enable the visualization of premises and logical connections, supporting more organized and persuasive reasoning.
Imagine a business meeting where someone presents an idea, and instead of just describing it, they draw it out—showing how the different parts of the project connect and what dependencies exist. Suddenly, everyone in the room can see the full picture, not just bits and pieces. Imagine a world where, instead of just hearing someone’s argument, you could see the structure of it—the premises, the connections, the leaps.
Conclusion: Making the Invisible Visible
Visual logic transforms abstract reasoning into tangible representations, bridging the gap between complex ideas and intuitive understanding. By making the invisible visible, it allows us to see the underlying structures of logic, facilitating better comprehension, communication, and innovation.
It is time to harness the power of visual logic to enhance understanding across all sectors. By adopting visual approaches to logic and reasoning, we can empower individuals to think more clearly, communicate more effectively, and make more informed decisions. Let us embrace visual logic as a vital tool, fostering a culture of clarity and insight in an increasingly complex world.
References
-
Charles Sanders Peirce, Stanford Encyclopedia of Philosophy, revision 11 Feb 2021.
-
John F. Sowa, Conceptual Graphs, Chapter 5 of the Handbook of Knowledge Representation, Elsevier, 2008, pp 213-237.
- John F. Sowa, Existential Graphs - The simplest notation for logic ever invented, 10 Jan 2020.
- This is a presentation slides.
-
John F. Sowa, Language, Ontology, And the Semantic Web, eswc20 slides, 1 Sep 2020.
- John F. Sowa, Knowledge Graphs for Language, Logic, Data, Reasoning, Ontolog Forum video, 12 Feb 2020.
- Presentation by John Sowa on the history of knowledge graphs, with applications to language, logic, data, reasoning, and more. Part of the Ontology Summit 2020. The slides are available at https://go.aws/2SkRNc3.
-
Mark P. Mattson, Superior pattern processing is the essence of the evolved human brain, Frontiers in Neuroscience, Vol.8, 21 Aug 2014. https://doi.org/10.3389/fnins.2014.00265
-
Curtis Newbold, Use Pictures. Always. Why the Picture Superiority Effect (PSE) Matters, The Visual Communication Guy, 6 Nov 2018.
- Team Varthana, Importance of Visual Aids in Teaching and Why it is Preferred, Varthana, 29 Dec 2022.
Historical References
-
J. Venn M.A. (1880) I. On the diagrammatic and mechanical representation of propositions and reasonings , Philosophical Magazine Series 5, 10:59, 1-18, DOI: 10.1080/14786448008626877 To link to this article: http://dx.doi.org/10.1080/14786448008626877
-
John F. Sowa, Conceptual Structures: Information Processing in Mind and Machine, Addison-Wesley, 1984. ISBN: 978-0201144727
-
Grady Booch, Ivar Jacobson, and James Rumbaugh, The Unified Modeling Language User Guide, Addison-Wesley, 2005. ISBN: 978-0321267979
-
M. Quillian, Semantic Memory, in M. Minsky (ed.), Semantic Information Processing, pp 227-270, MIT Press, 1968.
-
Maurice Karnaugh, The Map Method for Synthesis of Combinational Logic Circuits (PDF). Transactions of the American Institute of Electrical Engineers, Part I: Communication and Electronics, 72 (5): 593–599. doi: 10.1109/TCE.1953.6371932.
