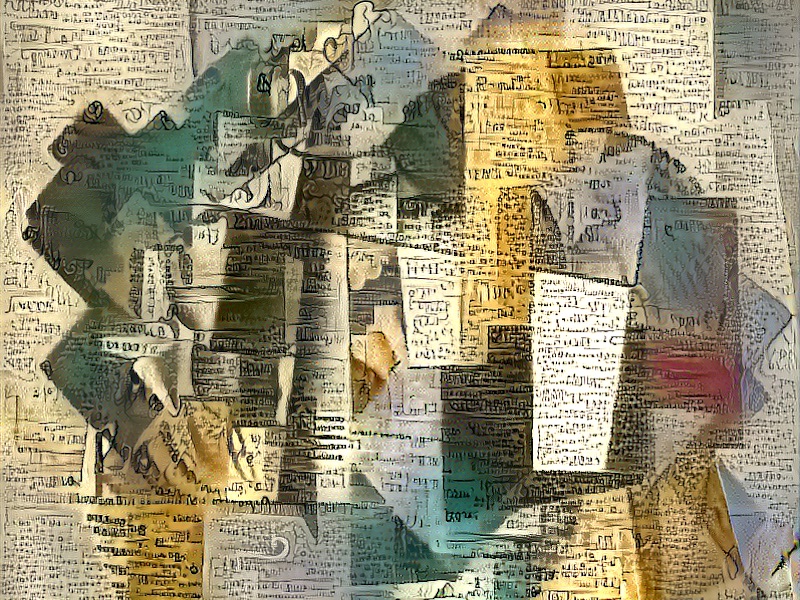
artwork by Style of Kandinsky's TransverseLine transfer to World Hex Grid
Interactive Hex World Map using D3
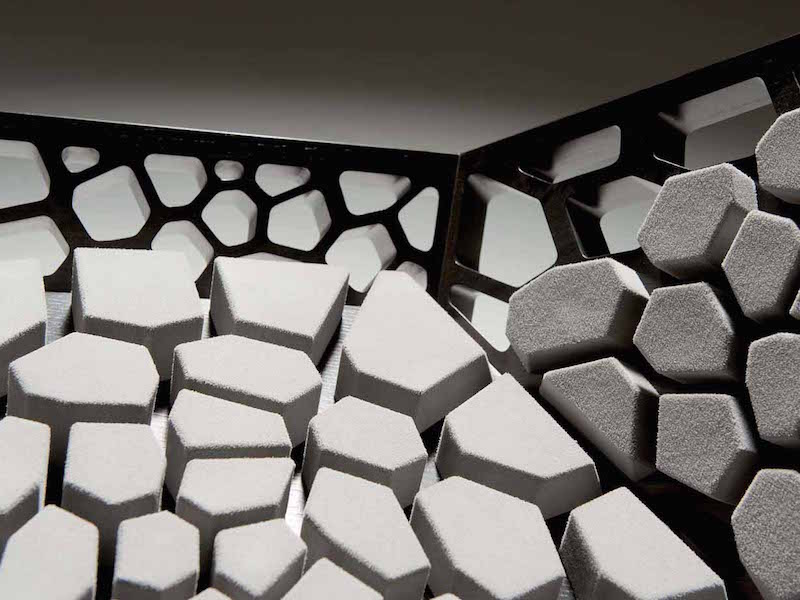
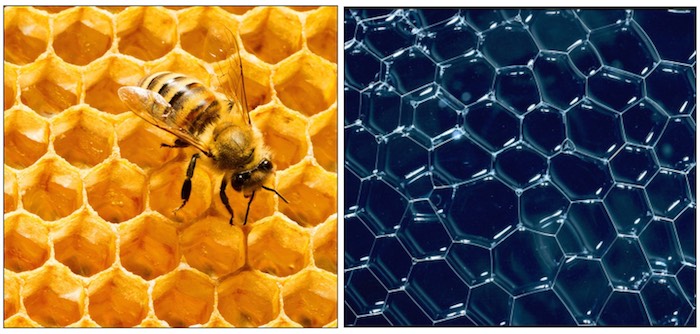
How does the nature inspires us about the optimal geometry? The bees create their honeycombs with precision engineering, an array of prism-shaped cells with a perfectly hexagonal cross-section. If you blow a layer of bubbles on the surface of water, they instantly rearrange into three-wall junctions with more or less equal angles of 120 degrees between them. You will never find a raft of square bubbles. There is great explanation that the law of nature, which automatically optimized in a self-organized system, which approximate to hexagons, read more from Why Nature Prefers Hexagons (2016).
I remembered the pleasure of reading The Computational Beauty of Nature. The topics in the book taught me an important lesson, development can be divided into immediate needs for professional life and spiritual food for enriching life. Spatial Tessellation belongs to the spiritual side of my computing adventure, because spatial representation and reasoning are my on-going research thesis. I sense the pure fun of the spatial computing and try to bring my understanding closer to nature.
This article will take on the following investigation path,
- Understanding the hexagonal coordinate system
- Creating the hexagonal grid to cover the world
- Aggregating the world terrian into the hexagonal grid
- Projecting the hexagonal grid onto a globe
- Implementing the hexagonal grid and the globe for visualization in D3
You will see a working interactive demo in this page; subsequently you can checkout the demo code yourselves to play.
Covering Earth with Hexagonal Map Tiles
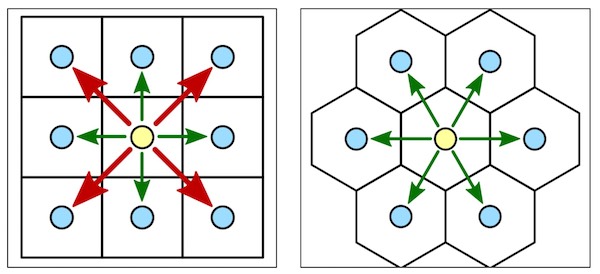
On the practical side of tessellation, many strategy games have good reason to choose the hexagonal tiles as their game board. One of the main advantages is that the distance between the center of any tile and all its neighboring tiles is the same. In term of strategy, this equidistance property enables consistent strategic moves (see the right diagram below, move to all connected cells is 1 (green arrow)) When comparing with the rectangular grid, the diagonal move is unfair because it takes 1 step but the equivalent orthogonal move takes 2 steps (see the left diagram of rectangular grid, the diagonal move (red arrow) is equal taking 2 orthogonal moves (green arrows)).
I was wondering if anyone has any thoughts on marrying a hexagonal tile system with the traditional geographic system (longitude/latitude). I think it would be interesting to cover a globe with hexagonal tiles and be able to map a geographic coordinate to a tile. This is a topic belongs to The Promise of Discrete Global Grid Systems, which is beyond my speculation.
Hexagon Coordinate System
To understand Hexagon Coordinate System and it’s mathematics, the excellent website that comes to mind is Amit’s game programming information and his collection of interactive explanation on Hexagon Grids. This article will simply use the results explained by Amit.
Unlike the familiar Cartesian Coordinate System that we learned since our high school days, which has only 1 type of grid layout. Hexagon Coordinate System comes with 4 types of grid layout! For this article’s world map, I choose to use the “odd-r” horizontal layout, which shoves odd rows right.
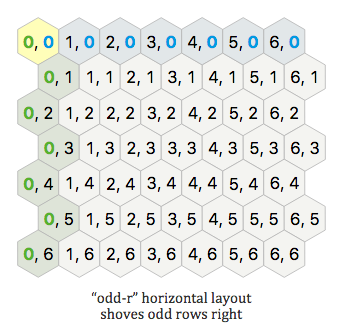
You are free to choose other hex layout type but the mathematics is slightly different. See later, the
hexlib.jsimplementation supposed to support all 4 layout types.
Hexagon Binning
D3 comes with a Hexagon Binning package, useful for aggregating data into
a coarser representation for display. Rather than rendering a scatterplot of tens of thousands of points,
bin the points into a few hundred hexagons to show the data. The hexbin is chosen to use color encoding
of the average height of the world’s terrain height image (the smaller black & white picture).
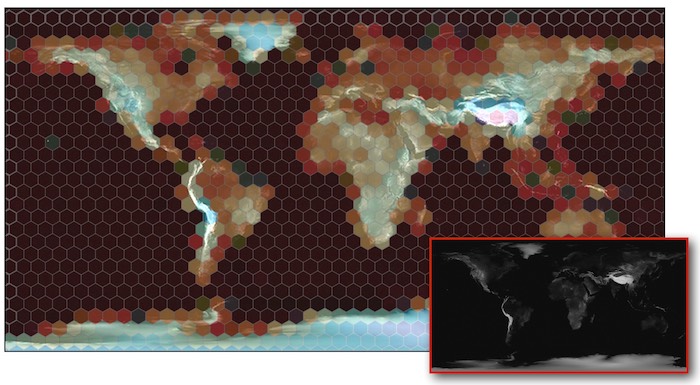
For all the terrain pixels that fall within the same hex bin, the average pixel value is calculated and mapped to a color, where the gradient map from red (is low) and blue (is high) altitude.
Hexagonal Grid Generation and Projection
In order to support the interactivity, the three Javascript files are combined to map the screen coordinate to the corresponding hex grid coordinate. Also, the location of the hex point is sent to display on a rotating globe.
<script src="js/hexmap/hexlib.js"></script>
<script src="js/hexmap/hexlib_ui.js"></script>
<script src="js/hexmap/hexglobe.js"></script>
Unfortunately, the 2D hex cylindrical map projecting onto a 3D spherical map is not perfect (no matter what you do, the projection will be distorted), as you can see towards the north/south poles, the area of the hex cells are distorted. May be the interested reader can enhance the code?
The full demo source code can be checkout from the companion D3HexMap github repo. More explanation will come after the demonstration.
Demo Interactive Visualization
Try to move your cursor over the hex grid to view the globe rotated to center (the red dot) on the highlighted hex cell.
Implementation Details
hexlib.js
The hexagonal representation and mathematic functions are implemented in hexlib.js,
which is essentially Amit’s Hex Grid implementation, details are here https://www.redblobgames.com/grids/hexagons/implementation.html
hexlib_ui.js
The hex grid interactivity is provided by hexlib_ui.js,
which is carefully extracted and cleaned up from the hexagon explanation page at http://www.redblobgames.com/grids/hexagons.html,
making the code has minimal dependencies so that the script can be easily reused on other pages.
The makeGridDiagram(svg, cubes) will take,
- Convert a list of hexagonal cube object, and create a list of nodes = {cube: Cube object, key: string, node: d3 selection of
containing polygon} - Make diagram = d3 selection of root
of diagram - Make polygons = d3 selection of the hexagons inside the
per tile - Define update = function(scale, orientation) to call any time orientation changes, including initialization
- Setup onLayout = callback function that will be called before an update (to assign new cube coordinates);this will be called immediately on update
- Setup onUpdate = callback function that will be called after an update; this will be called after a delay, and only if there hasn’t been another update
The hex grid diagram is later called with addHexCoordinates() from hexglobe.js function makeHexOddR();
this is how the interactivity of the mouse movement is detected.
If the mouse is over the hex grid,
the selected (row,column) cells are classed with highlighting, and the globe’s updateGlobe() function is called with the selected cell (lon, lat) for the globe rotation and view.
hexglobe.js
Finally with the support of previous routines,
the hexglobe.js adds a set of convenience functions to build the interactive hex grid and globe for the visualization. They are briefly described here,
makeHexOddR(svg, hexsize, width, height)- create a “odd-r” hex grid, with the given hexagon pixels size, and the width, height of the reference terrain image.
screenToLonLat(grid_odd_r, screenPoint)- transform the screen coordinate on the image to (lon, lat) point
hexToLonLatHex(grid_odd_r, hex)- transform the hex grid (q, r) coordinate to a polygon with the list of (lon, lat) points
hexWorldGrid(grid_odd_r)- create topojson line features for the hex world grid
makeHexBinMap(grid_odd_r, hexbin_id, hexsize, image_url, width, height)- define d3.hexbin
- define the color gradient map
- read the terrain image and hexbin() each pixel value
- for each hex, find the average of the pixel values
- for each hex, map the average pixel value to a color, according to it’s gradient range.
- construct the world hex “odd-r” grid with all the colored hex polygons
The globe is constructed from world-110m.json topojson file, then the hex grid is projected onto the globe surface. A timer is setup to check if the globe’s projection has been updated; consequently, the global will be rotated and redrawn to center at the given (lon, lat) location.
Putting Together
The main visualization index.html can be checkout from here.
Here is the html code,
<h1>Interactive Hex Global Visualization</h1>
<p>
Try to move your cursor over the hex grid to view the globl rotated to center (the red dot) on the highlighted hex.
</p>

<link rel="stylesheet" href="css/hexmap/hexlib.css">
<script src="js/d3/d3.v3.min.js"></script>
<script src="js/d3/topojson.v1.min.js"></script>
<script src="js/d3/d3.hexbin.js"></script>


<div id="globecontainer">
</div>

<div class="float-container">
  <div style="width:280px;display:inline-block;margin:5px">
    <svg id="grid-offset-odd-r" width="800" height="417"></svg>
  </div>
</div>

<div id="hexbin"></div>

<script src="js/hexmap/hexlib.js"></script>
<script src="js/hexmap/hexlib_ui.js"></script>
<script src="js/hexmap/hexglobe.js"></script>

<script>
  var grid_odd_r = makeHexOddR("#grid-offset-odd-r", 10, 800, 417);
  makeHexBinMap(grid_odd_r, "#hexbin", 10, "images/world_height.png", 800, 417);
</script>

<script src="js/hexmap/globe.js"></script>

<script src="js/jquery/jquery-1.7.min.js"></script>
<script src="js/jquery/jquery.event.drag-2.2.js"></script>
Inspire and tell me any further modification and application of the supplied code! Please enjoy your hexagonal journey.
Other Interesting Hexagon Grid Layout
Also, take a look at vraid/earthgen,
it uses hexagons (plus a few pentagons) to generate a simulated earth surface and includes source code (see planet/grid/create_grid.cpp).